EduTopics: ECER – A WebApp for exploring ECER contributions since 1998
30 years of EERA means 30 years of ECER conferences. 30 years of discussions. 30 years of inspiring new research ideas, setting trends but also reflecting and adapting to paradigm shifts in terms of educational issues and methodological advancements. This momentous occasion is not only an anniversary to be celebrated and should be a point of retro- and introspection, but also of tone and theme setting for the future of educational research. After all, ECER is and always has been one of the central yearly occasions to reflect on one’s own work and determine potential future avenues of research. But as George Santayana once (allegedly) said: “To know your future, you must know your past.”
Which is easier said than done, when one glance at the sheer number of networks, authors and their contributions at ECER shows the vastness of educational research and investigated topics over the years and its heterogeneity. This vastness and heterogeneity are not only challenges to be overcome, but also a resource to be harnessed to identify past, current and potentially future trends in educational research. And this is exactly where EduTopics: ECER comes into play – the project on which this post is based.
Enabling users to explore past and present ECER contributions

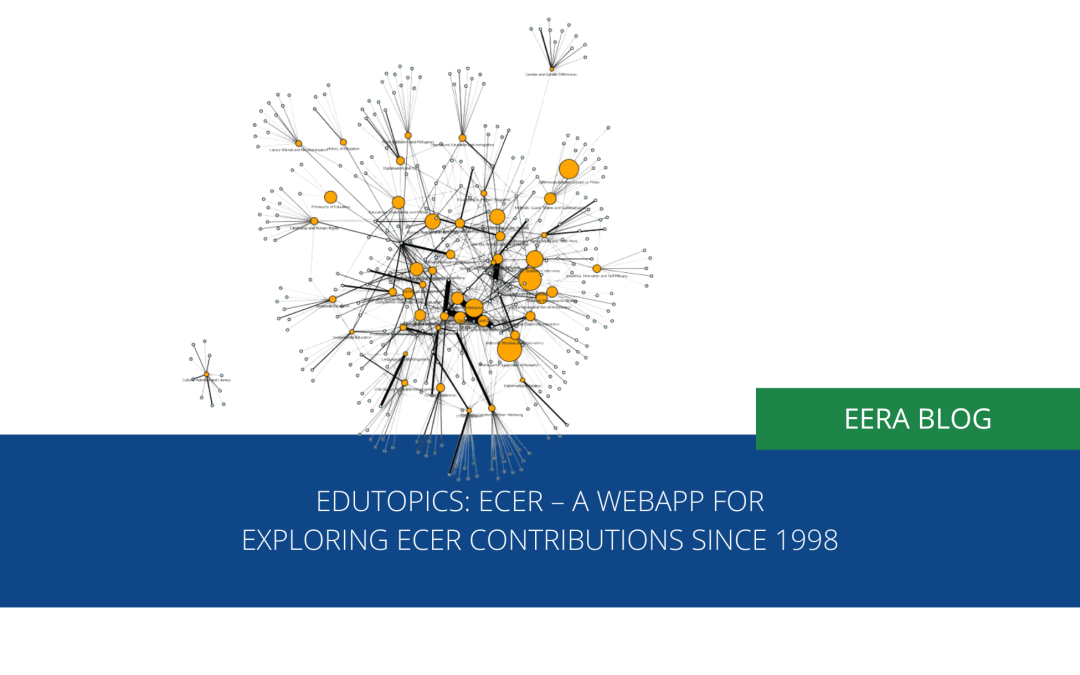
The main goal of EduTopics:ECER was to enable interested users to explore the corpus of contributions to the past (and present) ECER conferences. As gaining an overview of over 30,000 contributions in over 30 networks (see Figure 1) from thousands of authors is no small feat, we applied natural language processing, machine learning and clustering procedures to analyze and cluster the corpus. Procedures from those methodological areas were utilized to analyze the number of contributions related to the various ECER networks, authors, affiliation countries or years, and to determine the central topics of research across the years. For this purpose, we used topic modelling to determine the most frequent research topics across over 30,000 contributions and over 30 networks (see the methods section of the app for a detailed explanation and further references on topic modelling).
On the one hand, the topic modelling process resulted in topics clearly associated with singular networks, such as topics on “history of education”, “vocational education”, or “teacher education”; on the other hand, cross-cutting topics relevant to a multitude of ECER networks were also identified, such as “transitions and decisions (in education)”, “emotions, motivation and self-efficacy” or methodological topics such as “ethnographic studies” or “reviews and bibliometrics”.

Figure 2. Screenshot of the interactive plot on the topic-relevancy over the years from 1998 to 2024 for the topic “Quantitative Scales and Questionnaires“

Figure 3. Screenshot of the interactive plot on the top 5 ECER networks for the topic “Quantitative Scales and Questionnaires“ from 1998 to 2024
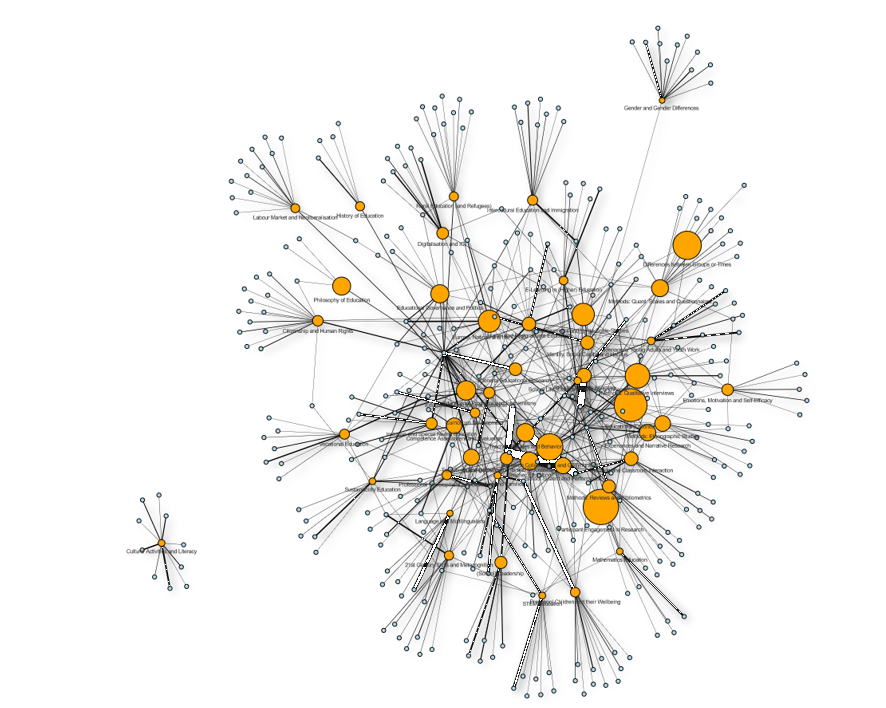
Users can explore the topics, their main authors, central contributions and yearly trends (see Figure 2), and explore the relevancy of the topics for each single author (with at least n = 5 contributions to ECER) or ECER network (see Figure 3). As simple lists of words, documents, authors and years may be happiness-inducing to some (us included) – they may not have the same effect on all. Therefore, for each variable and variable intersection, interactive visualizations were added to the app. Users can filter, zoom or even download the figures provided in the app. For those figures, we adapted “modern” interactive visualization techniques such as graph-drawings (see Figure 4) or 2D and 3D-mapping-scatterplots (see Figure 5) of the topics to enable users to identify the relationships, similarities or dissimilarities between the topics.

Figure 4. Screenshot of the interactive graph-plot of all k = 50 topics and all topic-indicative-terms with a term-topic-weight of at least 1%. The local and global structure of the graph was determined with a force-directed-graph-drawing-algorithm.

Figure 5. Screenshot of the interactive three-dimensional t-SNE-cluster-plot for the top n = 200 contributions of the topics “Gender and Gender Differences”, “History of Education” and “Philosophy of Education”.
Furthermore, the app includes a section which enables the users to export samples at the intersection of ECER networks, topics and year of publication. If, for example, a user happens to be interested in contributions from the network “Sports Pedagogy” on the topic “Digitalisation and ICT” from 1998 to 2024, three simple clicks show all contributions related to this input (see Figure 6), and one more click leads to the download of the list of contributions.

Figure 6. Screenshot of an example for the export-function for the intersection of ECER network “18 – Sports Pedagogy” and the topic “Digitalisation and ICT” for 1998 to 2024. The resulting table shows all contributions for the selected settings, including their hyperlink to the ECER database of abstracts.
The final interactive feature of the app allows users to insert any text into an input field. With one click, the text is mapped in relation to the corpus, resulting in the topics with the highest relevancy to the mapped text, as well as the most likely associated ECER networks and most similar contributions of the past ECER conferences to the entered text (which can be downloaded with one click, see Figure 7).

Figure 7. Screenshot of the app section on mapping individually entered texts. The text-example is the abstract from Christ, Penthin & Kröner (2021). The plots display the most likely topics and ECER networks of the entered text. The table displays the ECER contributions with the highest similarity to the entered text based on the lowest total euclidean distance between the document-topic-probabilities of the entered text and all ECER contributions.
Conclusion
In conclusion, this post presents a free tool for the exploration of the contributions to ECER from 1998 to 2024. It serves multiple purposes, as it may be used for creating plots and figures for publications, for answering research questions – for example on the cooperation between authors at ECER – or just for some light-hearted and fun exploration and discovery.
If you use the tool for your own research, we would be happy to link and mention your publications in a section of the app currently under development. We want to invite and encourage you to use the app to your heart’s content to explore the past ECER conferences, to look at the topics and your networks or to look up yourself, including which topics were assigned to your contributions.
We are happy to hear your thoughts about the app’s functions and its design and even, perhaps, about unexpected and surprising results and findings you encounter while using it. As an EERA-funded network seed project, EduTopics:ECER will be updated with next year’s contributions as well as new functions.
As a final note, we hope we could satisfy your curiosity, and give you a little bit of insight into the potentials and boundaries of natural language processing and machine learning for your own research.
Key Messages
- EduTopics: ECER enables users to explore the contributions to past and present ECERs
- Over 30,000 contributions from more than 30 networks are searchable due to natural language processing, machine learning and clustering procedures.
- In the EduTopics: ECER app, the central k = 50 themes of ECER contributions from 1998 to 2024 have been identified
- Key insights can be gained by intersecting the k = 50 themes with covariates such as EERA networks or authors
- All results and visualizations are interactive and free to use.

Dr Alexander Christ
DIPF|Leibniz Institute for Research and Information in Education
Alexander Christ works at the DIPF | Leibniz Institute for Research and Information in Education as a researcher on the application of machine learning, natural language processing and quantitative (big data) methods for the analyses of large literature corpora. His work focusses on developing and providing statistical code and interactive tools designed that open up new perspectives on and new avenues for research processes as well as empower their users.

Jens Röschlein
DIPF|Leibniz Institute for Research and Information in Education”
Jens Röschlein works at the DIPF | Leibniz Institute for Research and Information in Education for the German Education Portal and the German Education Server.

Christoph Schindler
Deputy Head, Information Center Education, DIPF | Leibniz Institute for Research and Information in Education
Christoph Schindler is Link Convenor (NW 12 “Open Research in Education”), deputy head of the department “Information Center Education” (IZB) at the DIPF | Leibniz Institute for Research and Information in Education and team leader (“Literature Information System”).
His team operates the German Education Portal, the German Education Index and the Open Access repository peDOCS. His interests are open science (open research information, open access), infrastructure design, graph technologies and science and technology studies.
